Use a repeatable interpretation sequence, recognize STEMI and occlusion-equivalent patterns, localize ischemia, assess conduction and intervals, and distinguish common mimics.
Clinical source summary · Updated 2026-09-16
Interpret the ECG with the patient
A normal or nondiagnostic 12-lead does not rule out ACS. Persistent or changing symptoms require reassessment and serial tracings.
Do not let a computer statement override the tracing, clinical presentation, reciprocal changes, or dynamic evolution.
Ordinary STEMI millimeter thresholds are not the only acute-occlusion patterns; actively check posterior MI, modified Sgarbossa, de Winter, hyperacute T waves, and high-risk ischemic changes.
This educational interpretation guide does not create an independent OCEMS activation rule. Transmit concerning tracings and use base-hospital direction and current policy.
Use the same sequence every time
Interpret the tracing in clinical context: symptoms, onset, vital signs, perfusion, medications, electrolytes, prior cardiac history, and any earlier ECG. A technically normal or nondiagnostic ECG does not exclude ACS.
Confirm patient identity, date/time, standard calibration of 25 mm/s and 10 mm/mV, lead placement, and freedom from motion or electrical artifact. Repeat a poor-quality tracing before acting on subtle morphology.
Read the tracing yourself before accepting the automated statement. Computer interpretation is an adjunct; accuracy varies and is reduced by paced rhythms, bundle branch block, tachycardia, artifact, and small ST shifts.
When suspicion remains high, compare with an old tracing and repeat ECGs over short intervals. Dynamic changes may reveal an evolving occlusion that the first tracing missed.
Step
Question
1 · Quality
Correct patient, calibration, lead placement, baseline, artifact?
2 · Rate
Atrial and ventricular rates; regular or irregular?
3 · Rhythm
P waves, QRS relationship, AV association, ectopy?
ST elevation/depression, T-wave change, reciprocal change, STEMI equivalent?
8 · Compare & act
New or dynamic? Does it change treatment, transmission, destination, or urgency?
Rate & rhythm
For a regular rhythm at 25 mm/s, estimate rate as 300 divided by the number of large boxes between R waves, or 1500 divided by small boxes. For an irregular rhythm, count QRS complexes in 6 seconds and multiply by 10.
Decide whether P waves are present, uniform, and linked to each QRS. Measure atrial and ventricular rates separately when they differ, and look for dropped beats, premature complexes, and AV dissociation.
A sinus rhythm usually has an upright P wave in leads I and II, a negative P in aVR, one P before each QRS, and a consistent PR interval. Do not label a rhythm sinus from the ventricular rate alone.
Pattern
Key 12-lead clues
Sinus rhythm
Uniform sinus P waves; 1:1 P-QRS relationship; fixed PR.
Atrial fibrillation
Irregularly irregular R-R intervals; no consistent organized P waves.
Atrial flutter
Regular atrial activity, often near 300/min, with sawtooth waves best in II, III, aVF or V1; AV conduction may be fixed or variable.
Regular narrow tachycardia
QRS under 120 ms; inspect for hidden, retrograde, or flutter P waves before assigning mechanism.
Wide-complex tachycardia
QRS at least 120 ms. Treat as ventricular tachycardia when uncertain, especially with AV dissociation, capture/fusion beats, extreme axis, or structural heart disease.
Ventricular escape/pacing
Wide QRS with slow escape or pacing spikes; assess capture, sensing, and underlying AV relationship.
Axis, intervals & conduction
Use leads I and aVF for a rapid axis quadrant. If I is positive and aVF negative, inspect lead II: a positive II keeps the axis between -30° and 0°; a negative II supports left-axis deviation.
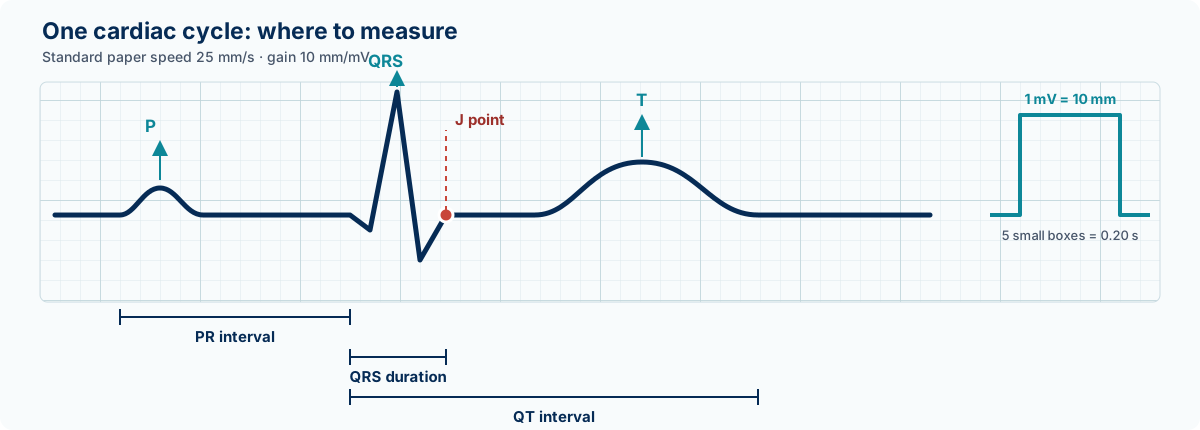
Measure intervals on a clean complex. At standard speed, one small box is 40 ms and one large box is 200 ms. PR is normally about 120-200 ms and an adult QRS is under 120 ms.
Assess QT from QRS onset to T-wave end and use a rate-corrected QT. A QTc at or above 500 ms is a high-risk marker for torsades, especially with bradycardia, pauses, electrolyte abnormality, or QT-prolonging drugs.
Waveform anatomy at standard calibration. Measure from consistent landmarks on a clean complex; one small box is 40 ms horizontally and 0.1 mV vertically.
Finding
Practical criteria
Normal adult axis
About -30° to +90°. Lead I positive; aVF usually positive.
Left-axis deviation
More negative than -30°: I positive, aVF negative, and II negative.
Right-axis deviation
Beyond +90°: I negative, aVF positive. Consider right-heart strain, RVH, LPFB, or limb-lead reversal.
Extreme axis
I and aVF both negative. Consider ventricular rhythm, severe right-heart disease, hyperkalemia, or lead error.
RBBB
QRS at least 120 ms; rsR′/terminal R′ in V1-V2 plus broad terminal S in I and V6.
LBBB
QRS at least 120 ms; broad/notched R in I, aVL, V5-V6; absent lateral q waves; deep broad S in V1.
LAFB
Axis -45° to -90°, qR in aVL, rS in inferior leads, and QRS under 120 ms unless another block coexists.
LPFB
Axis +90° to +180°, rS in I/aVL and qR in III/aVF after excluding RVH and other causes of right axis.
AV block & pre-excitation
Name the atrial rhythm first, then determine whether every P conducts and whether the PR changes. In 2:1 block, the surface ECG may not distinguish Mobitz I from Mobitz II; treat the patient and the risk, not an overconfident label.
A short PR with a slurred initial QRS upstroke (delta wave) and widened QRS suggests ventricular pre-excitation. Irregular wide tachycardia in a pre-excited patient is high risk and should not be mistaken for ordinary atrial fibrillation with aberrancy.
Pattern
ECG relationship
First-degree AV delay
Every P conducts; PR over 200 ms and constant.
Mobitz I (Wenckebach)
Progressive PR lengthening before a nonconducted P, then cycle resets.
Mobitz II
Constant PR intervals with sudden nonconducted P waves; often wide QRS and infranodal disease.
2:1 AV block
Every other P is blocked; level cannot be reliably assigned from ratio alone.
High-grade AV block
At least two consecutive P waves fail to conduct while some AV conduction remains.
Third-degree AV block
Atrial and ventricular activity are independent; PR relationships vary with an escape rhythm.
Chamber clues, R-wave progression & Q waves
Voltage criteria suggest chamber enlargement but have limited sensitivity and must be interpreted with age, body habitus, conduction, and prior tracings. Do not use absence of voltage criteria to rule out structural disease.
Normal precordial progression moves from a predominantly negative QRS in V1 toward a predominantly positive QRS by about V3-V4. Poor progression can result from prior anterior MI, LVH, LBBB, cardiomyopathy, lead misplacement, or normal variation.
A Q wave is more concerning when it is wide and deep, appears in anatomically contiguous leads, and is new. A screening mnemonic is at least 40 ms wide and at least 25% of the following R-wave depth, but formal infarction criteria are lead-specific and require context.
Finding
Common screening criteria
Left atrial enlargement
P at least 120 ms with notching in lead II and/or a broad deep terminal negative component in V1.
Right atrial enlargement
Peaked P over 2.5 mm in II, III, or aVF.
LVH · Sokolow-Lyon
S in V1 plus R in V5 or V6 at least 35 mm; lateral strain may add downsloping ST depression and asymmetric T inversion.
LVH · Cornell voltage
R in aVL plus S in V3 over 28 mm in men or over 20 mm in women.
RVH
Right-axis deviation with dominant R in V1 (R/S over 1) and persistent deep S in V5-V6 after excluding RBBB and posterior MI.
STEMI recognition: measure the J point
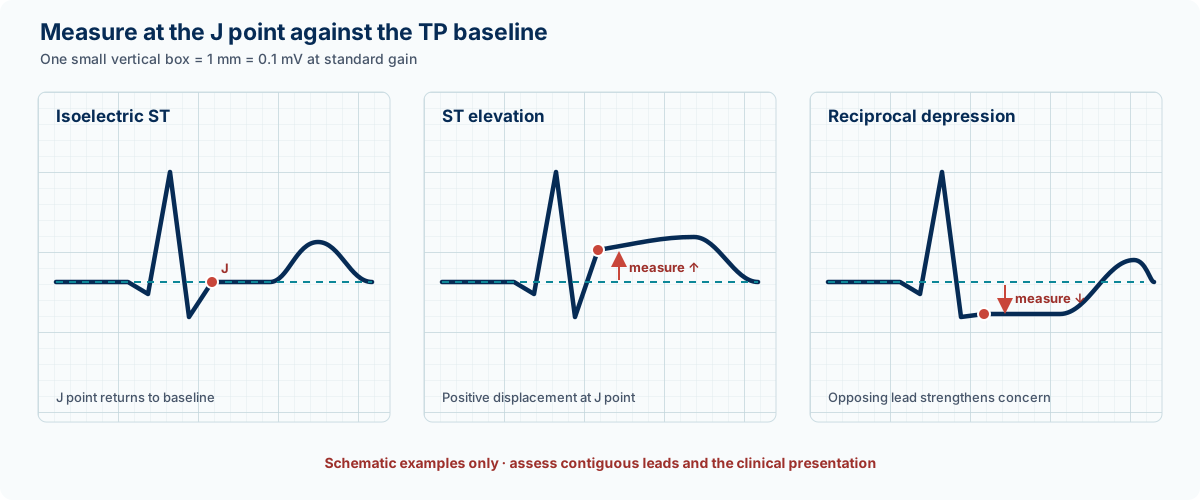
Look for new ST elevation at the J point in at least two anatomically contiguous leads. Use the TP segment as baseline when possible and verify that apparent elevation is not caused by wandering baseline, lead misplacement, LVH, bundle branch block, or ventricular pacing.
Threshold criteria support recognition; they do not replace the clinical picture. Subtle elevation below the numeric cutoff can still represent acute occlusion when it is new, dynamic, hyperacute, or paired with reciprocal depression.
Reciprocal ST depression in an opposing territory increases concern for acute coronary occlusion and can help distinguish territorial injury from diffuse pericarditis or benign early repolarization.
Measure the ST segment at the J point against the TP baseline. These traces are teaching schematics; morphology, contiguity, reciprocal change, symptoms, and serial evolution all matter.
Leads
ST elevation threshold in 2 contiguous leads
All leads except V2-V3
At least 1 mm (0.1 mV).
V2-V3 · men under 40
At least 2.5 mm.
V2-V3 · men 40 or older
At least 2.0 mm.
V2-V3 · women
At least 1.5 mm regardless of age.
Posterior V7-V9
At least 0.5 mm; a 1 mm cutoff is more specific and is used for men under 40 in the Universal Definition.
Right-sided V3R-V4R
At least 0.5 mm; use 1 mm in men under 30.
Localize the ischemic territory
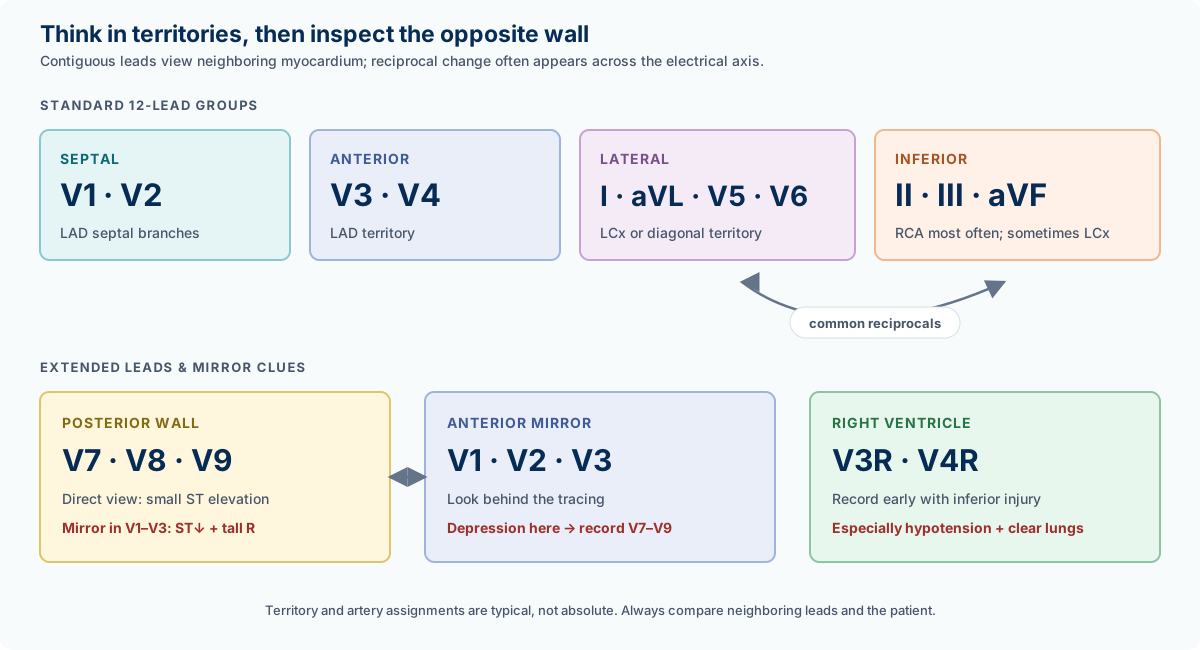
Identify the leads with the primary ST change, then deliberately inspect the reciprocal territory. Artery assignments are typical rather than absolute because coronary anatomy varies.
Inferior injury with hypotension, clear lungs, bradycardia, or AV block should prompt early right-sided leads. Anterior ST depression with a tall R wave should prompt posterior leads.
Lead territories and common reciprocal relationships. Coronary anatomy varies, so use the map to organize the tracing rather than to assign a culprit artery with certainty.
Territory
Primary leads
Common reciprocal change
Typical artery
Septal
V1-V2
May be absent
LAD septal branches
Anterior
V3-V4
II, III, aVF
LAD
Lateral
I, aVL, V5-V6
III, aVF
LCx or diagonal
Inferior
II, III, aVF
I and aVL
RCA most often; sometimes LCx
Posterior
V7-V9 elevation
V1-V3 depression with tall R/upright T
RCA/PDA or LCx
Right ventricle
V3R-V4R elevation; sometimes V1
Often accompanies inferior injury
Proximal RCA most often
Occlusion equivalents & high-risk ischemia
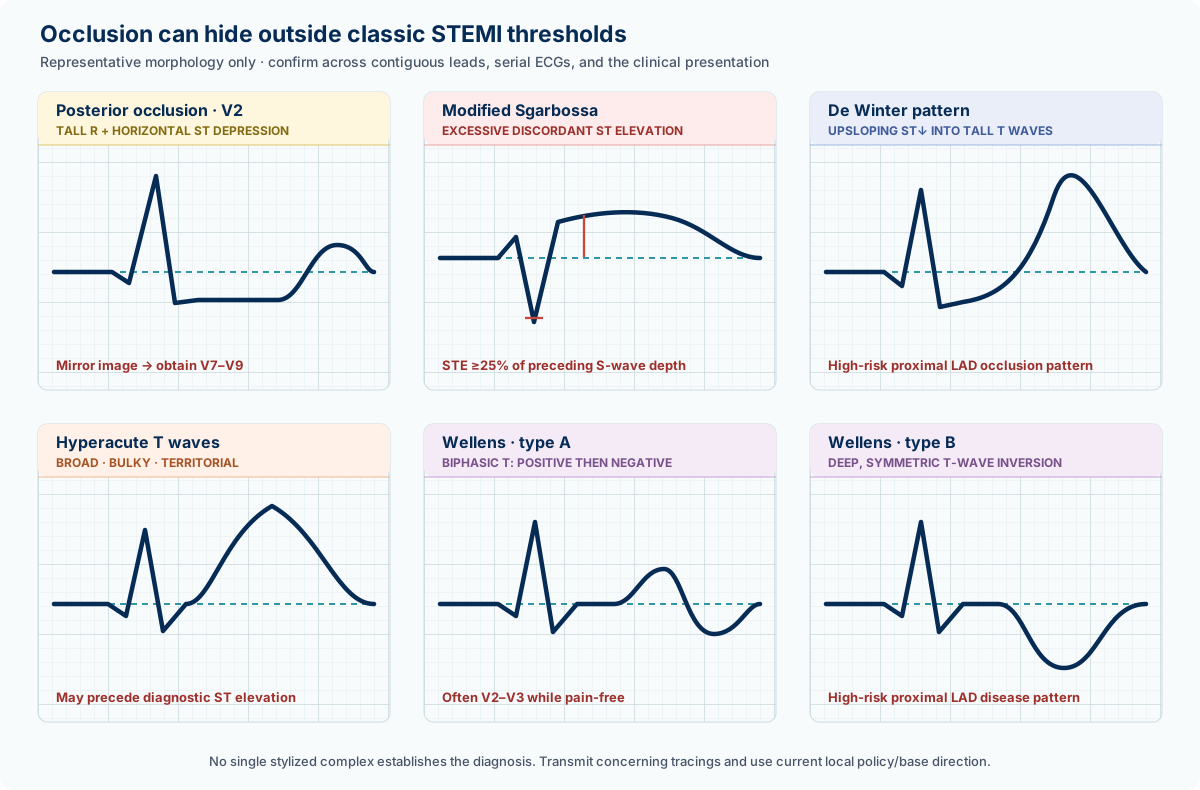
A patient can have acute coronary occlusion without meeting ordinary ST-elevation thresholds. The patterns below should trigger immediate expert/base review, transmission, serial ECGs, and destination planning rather than reassurance.
New horizontal or downsloping ST depression of at least 0.5 mm in two contiguous leads or new deep symmetric T-wave inversion can represent ischemia even without STEMI. Treat the patient as high risk when symptoms and dynamic changes fit.
High-risk pattern recognition. These simplified single-complex examples are memory aids—not diagnostic templates. Confirm patterns across contiguous leads, compare serial tracings, and interpret them with the patient.
Pattern
Recognition clues
Meaning / action
Posterior occlusion
Horizontal ST depression V1-V3, dominant broad R in V2, upright anterior T; confirm with V7-V9 elevation at least 0.5 mm.
STEMI equivalent; transmit and seek immediate reperfusion evaluation.
Modified Sgarbossa
In LBBB or ventricular pacing: concordant STE at least 1 mm; concordant STD at least 1 mm in V1-V3; or discordant STE at least 1 mm and at least 25% of the preceding S-wave depth.
Any criterion is positive and should be treated as high risk for occlusion.
De Winter pattern
Upsloping J-point depression over 1 mm with tall, symmetric precordial T waves; aVR may show slight elevation.
Broad, bulky, asymmetric T waves disproportionate to the QRS and localized to a coronary territory, often with reciprocal change.
May precede diagnostic ST elevation; repeat very early and transmit.
Wellens pattern
Pain-free or improved patient after recent angina with biphasic or deeply symmetric T inversion in V2-V3, often extending to V6, without established anterior Q waves.
High-risk proximal LAD disease; not a reassuring resolved episode.
Diffuse subendocardial ischemia
Widespread ST depression with ST elevation in aVR and no focal contiguous elevation elsewhere.
High-risk left-main/multivessel or supply-demand pattern; urgent expert evaluation, not automatic proof of one culprit lesion.
Extended leads & serial ECGs
For suspected posterior occlusion, place V7 at the left posterior axillary line level with V6, V8 at the tip of the left scapula on the same horizontal plane, and V9 at the left paraspinal region. Label the leads and note that the diagnostic elevation is small.
For inferior ischemia or suspected right-ventricular involvement, record V3R and V4R early because right-sided elevation can fade quickly. V4R mirrors ordinary V4 on the right fifth intercostal space at the midclavicular line.
Repeat the standard 12-lead after symptom change, treatment, rhythm change, or a nondiagnostic initial tracing with persistent suspicion. Keep lead positions consistent so serial differences reflect physiology rather than placement.
Common mimics & noncoronary danger patterns
A mimic is a competing explanation, not permission to dismiss symptoms. Compare old tracings, inspect for reciprocal changes, repeat the ECG, and transmit when uncertainty affects destination or reperfusion decisions.
Baseline LVH, LBBB, RBBB, and pacing create secondary ST-T changes. Disproportionate, concordant, new, or dynamic changes remain concerning for superimposed ischemia.
Pattern
Clues
Pitfall
Benign early repolarization
Stable concave anterior/lateral elevation, J-point notching or slurring, large concordant T waves, no territorial reciprocal depression.
Do not use shape alone; new symptoms, reciprocal change, or evolution favor occlusion.
Acute pericarditis
Diffuse ST elevation and PR depression, reciprocal PR elevation/ST depression in aVR and sometimes V1; symptoms may be positional or pleuritic.
Territorial elevation with focal reciprocal depression or hemodynamic instability requires alternate concern.
LVH strain
High voltage with lateral downsloping ST depression/asymmetric T inversion and discordant anterior elevation.
Use proportionality, prior ECG, symptoms, and dynamic change; LVH does not exclude ACS.
Ventricular aneurysm
Persistent elevation with mature Q waves and unchanged prior tracing after old anterior MI.
Without a prior ECG, acute occlusion may be indistinguishable in the field.
Hyperkalemia
Diffuse narrow peaked T waves, PR prolongation, P-wave flattening/loss, progressive QRS widening or sine-wave pattern.
Localized hyperacute T waves with reciprocal change favor coronary occlusion.
Brugada pattern
Coved ST elevation with T inversion in V1-V3 and a right-bundle-like appearance, often exposed by fever or sodium-channel blockers.
Syncope, nocturnal agonal breathing, fever, or family history increases urgency.
Pulmonary embolism / RV strain
Sinus tachycardia, right axis, RBBB, anterior T inversion, or S1Q3T3; none is sensitive or specific alone.
Use the ECG as supporting evidence only; shock, hypoxemia, and clinical probability drive concern.
Hypothermia
Bradycardia, prolonged intervals, atrial fibrillation, and J/Osborn waves near the end of the QRS.
Artifact from shivering can obscure the rhythm.
Electrolyte, drug & interval clues
ECG findings rarely identify a specific laboratory value. Use them to raise suspicion, protect against malignant rhythm, and communicate urgency; confirmation and definitive correction require the receiving system.
When QT appears long, check rate correction, compare with baseline, review medications, and look for pause-dependent ectopy, T-U distortion, or polymorphic ventricular activity.
Cause
Typical progression / clue
Hyperkalemia
Peaked T waves → PR prolongation/P loss → QRS widening → sine wave; progression is variable.
Hypokalemia
ST depression, T-wave flattening/inversion, prominent U waves, prolonged QU appearance, ventricular ectopy.
Hypocalcemia
QT prolongation mainly through a prolonged ST segment.
Hypercalcemia
Short QT, mainly through a shortened ST segment.
Digoxin effect
Scooped downsloping ST depression, flattened/inverted T waves, shorter QT; toxicity can produce many brady- or tachyarrhythmias.
Sodium-channel blockade
QRS widening, terminal rightward axis/terminal R in aVR, ventricular dysrhythmia; consider tricyclic or other sodium-channel toxicity.
QT-prolonging drugs
QTc at least 500 ms or increase over 60 ms from baseline signals higher torsades risk, especially with bradycardia or low K/Mg/Ca.
Field action in Orange County
Do not delay immediate stabilization, pacing, cardioversion, defibrillation, or transport to obtain or perfect a 12-lead. Treat the patient while acquiring the tracing when feasible.
Per OCEMS PR-105, relay the interpretation to the base hospital when indicated and transmit ECGs positive or suspicious for acute MI before arrival at the receiving cardiovascular center. Document the acquisition and interpretation and attach or upload the tracing to the PCR.
For classic STEMI, a STEMI-equivalent pattern, or dynamic high-risk ischemia, state the exact findings rather than only the monitor label: affected leads, millimeters at the J point, reciprocal changes, rhythm, QRS width, symptoms, vital signs, time of onset, and whether serial tracings are changing.
Use OCEMS standing orders and base direction for treatment and destination. A guide can sharpen pattern recognition, but it cannot replace current local activation criteria, complete source documents, or physician interpretation.